About "Catch & Research"

Welcome. I found my passion in ecological economics and fishing. They are all about pursuit of unknown and uncertain objects. I always enjoy the seemingly reckless pursuit itself. This blog is a record of my long journey in research and fishing. Your comments are welcome and appreciated.

Friday, May 30, 2008

Shad


I caught my first Shad. It was a surprise catch. I was casting Sabiki rig for Herring. Suddenly, I felt strong resistance at my rod tip. I have heard that shad gives awesome fight, but it was even better than I guessed. It was even bigger than I thought. Wow! After taking a picture, I released it. Currently, there is state wide ban on shad fishing. Because shad population has significantly decreased. Last year, I didn't catch any. I guess, thanks to the ban, I might catch my first shad this year.

Meeting with advisor (5/30): SDA

1. Basics of Structural Decomposition Analysis (SDA)
I wrote up the basics of SDA, which is available at http://docs.google.com/Doc?id=ddfmw3gd_10g33nbhhp. Now, I feel much confident about SDA.

But, still I am not fully sure about decomposition of final demand. Why did they use sum of final demand of each commodity? Isn't sum of final demand always equal to total final demand? I found that there is difference between summing result of each final demand and total final demand. But it was small and looked like a result from rounding error.

2. Next Goal
I have done a SDA practice with 7 sector I-O tables. I presented sources of change in intermediate output increase. Now, I will try SDA of total energy consumption change with hybrid I-O tables.

From now on, I will also focus on ISEE conference paper, topic of which is different from what I will do for my dissertation.

Thursday, May 29, 2008

Basics of Decomposition Analysis

I posted about "Basic decomposition" before. But at that time I was not so clear about it. Here is what I understand about it for sure.

Structural decomposition analysis(SDA) is an analytical method to find sources of dependent variable's change between two different time period. Sources of change are sought from basic relationship between dependent variable, independent variables and coefficients. Note: SDA always considers the possibility that coefficients change along with other variables. Change of coefficients is considered as a result from technological change. It is critical difference from growth accounting analysis (GAA), which presents technological change as a variable.

For example, let's say dependent variable Y can be expressed multiplication of independent variable X and coefficient a: Y= a*X. Now, we want to compare two different time period, t and t-1. There may be some difference in dependent variable (Yt - Yt-1), and we want to find sources of change.

Yt-Y(t-1) = [at*Xt] - [a(t-1)*X(t-1)] ---(1)

From this equation, we can consider three sources of change:
  1. Change from independent variable, when coefficient is fixed to original time (t-1): Level change
  2. Change from coefficient, when independent variable is fixed to original time (t-1): Technological change
  3. Change from interaction of independent variable and coefficient change: Joint change
In equation form,

Difference of dependent variable
= [initial period (t-1)'s coefficient: a(t-1)] * [change of independent variables: Xt -X(t-1)] <- 1.
+ [change of coefficient: at - a(t-1)] * [initial period (t-1)'s independent variable: X(t-1)] <- 2.
+ [change of coefficient: at - a(t-1)] * [change of independent variables: Xt -X(t-1)] <- 3.

In order to present these sources, we need add and subtract [a(t-1)*Xt] + [at*X(t-1)] + [a(t-1)*X(t-1)] to the equation (1).

Yt-Y(t-1) = [at*Xt] - [a(t-1)*X(t-1)]
+ {[a(t-1)*Xt] + [at*X(t-1)] + [a(t-1)*X(t-1)]}
- {[a(t-1)*Xt] + [at*X(t-1)] + [a(t-1)*X(t-1)]}

= [a(t-1)*Xt] - [a(t-1)*X(t-1)]
+ [at*X(t-1)] - [a(t-1)*X(t-1)]
+ [at*Xt] + [a(t-1)*X(t-1)] - [a(t-1)*Xt] - [at*X(t-1)]

= a(t-1) * [Xt - X(t-1)] : 1. level change
+ X(t-1) * [at - a(t-1)] : 2. technological change
+ [at - a(t-1)] * [Xt - X(t-1)] : 3. Joint change

It looks complicated. But gist of analysis is straight forward; it considers three possible cases when we assume independent variable and coefficient change between two periods: (1) only independent variable changes with fixed coefficient, (2) only coefficient changes with fixed independent variable, (3) both change. About economic meaning of each change, I will explain later.

Understanding this basics, I took a look at the final demand decomposition again. But still it looks vague. One burning question is whether sigma Yi is equal to Y. It is. Than second term of the decomposition analysis is always zero. In order to answer this question, I need to practice with real IO tables.

Monday, May 19, 2008

Tagged Striped Bass

I went out Striper fishing with Capt. M this weekend. Amazingly, both of us caught tagged stripers! M's fish had a pink string tag on its abdomen.The tag said, "REWARD Ph. 1-800-XXX-XXXX 000000" We kept the fish to report its measure. It was 16 pound 14 ounce heavy and 34 1/2 inches long. It was a big fish. Later I recovered the whole tag which was implanted under skin. The tag belonged to US Fish & Wildlife Service.

Considering of the shape of the tag, the fish might be farm-raised and released later for study. It is hard to imagine to implant this kind of tag onto wild catch; it requires small surgery. If I am wrong, please let me know. I am really curious how they planted this tag.

M called the number and informed catch location, time-date, weight and length. They offered a Striper hat as a reward. To be honest, Capt. M and I expected more (something like $500 cash reward, kikiki). But still nice!

I caught a small one, which has a yellow loop tag on its back. Because I was in rush to release it, I could not take a picture or measure it. Instead, I cut the tag to report. Actually, US FWS tag says "IF UNDERSIZE CUT OFF TAG -RELEASE FISH" So, I did that.

The tag belonged to the American Littoral Society. When I got back home I googled the society's information. Here is tagging related web page: http://www.littoralsociety.org/tagging_tagged_fish.aspx They have been doing tagging study for several years. At its website, you can see the data of tagging study. That is interesting. They do not offer a present like a hat, but they send information of the tagged fish; that's all I want! I downloaded and filled out their report form of tagged fish. I will see what I will hear from them. I will update you about it when I hear. It is such a good feeling to help conservation efforts.

Thursday, May 15, 2008

Meeting with Advisor. Decomposition equations

1. Basic decomposition of final demand

I have been struggled to understand basic decomposition equation of final demand (Casler & Rose, 1998 p. 354, equation (7)). Because this equation does not deliver clear economic implication by itself.


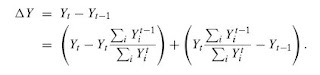
(Where, Y is final demand. t is period.)

First term of second line is final demand level effect, and second term is final demand mix effect. Level effect means pure change in final demand that would happen if final demand of each industry in period t had increased in the same proportion with total production increase between two periods. Mix effect means change in the mix of final demand while assuming the same level of final demand at the control period.

But the decomposition equation does not match with the definitions and is not explanatory; first term is comparing Yt and Yt, and second term is comparing Yt and Yt-1. Equation itself is correct and holds, but it does not explain. Instead, we can consider to compare Yt and Yt-1 for first term, and Yt-1 and Yt-1 for second term.

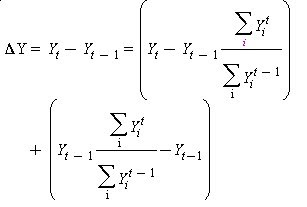
Here sigm Yt over sigma Yt-1 is GDP growth rate. Instead using GDP scalinging down factor as in Casler and Rose (sigma Yt-1 over sigma Yt), using GDP growth rate makes things much clear and matches with original definition of level & mix effect. Although we follow which ever decomposition equation, Casler & Rose's equation or mine, there will be no difference. I do not understand why the authors use the equation in their analysis. There must be some reason, for example to make calculation easier.

After all, it seems a tedious thing in the whole analysis. But just for record, I have been suffering for long time to understand their equation. It must be their intention to torture graduate students.

2. Next Goal

Understanding method of Gowdy & Miller (1987) Technological and demand change in energy use: an input-output analysis

3. House Keeping

My abstract for Nairobi ISEE conference got accepted. I will work with Carol to find a ticket.

Monday, May 5, 2008

Meeting with Advisor (5/5)

1. Potential Outline for Dissertation
  1. Importance of Energy (general introduction)
  2. Input-output Structural Decomposition Analysis (gneral, methodology)
  3. Energy Analysis in Korea
  4. Emissions Analysis in Korea
  5. Energy and Emission Policies in Korea
  6. Conclusion or Summary

2. Next Goal

Focuse on writing up chapter 2. I-O SDA. There are plenty of literatures available about this. Review them and find strength and weakness of this analysis. Then suggest my own approach.

3. House Keeping

Fall internship and possible delay of study plan. I will contact someone who is in charge of the fellowship.

Friday, May 2, 2008

Personal Best: Hudson Small Mouth Bass

Inspired by the yesterday success, I went fishing after school again. In the expectation to catch striper, I casted the same swimbait to the same spot. Believe it or not, I caught this huge small mouth bass at the same spot after couple of castings! It bit my lure so hard near shore. You can see my Leatherman multi-tool, which is 8 inch long. It was fat, too. It is definitely my personal best for sure. It is such a joy that I can catch big fish where is so close to my place in short outing.